Creating a Histogram Using RStudio

hist(data,main,xlab,ylab,xlim,ylim,col,border,breaks=?)
- Data = variable x
- Main = title
- Xlab = x label
- Ylab = y label
- Xlim = x limit
- Ylim = y limit
- Col = color of bars
- Border = color of bar borders
- Breaks = bucket or column width
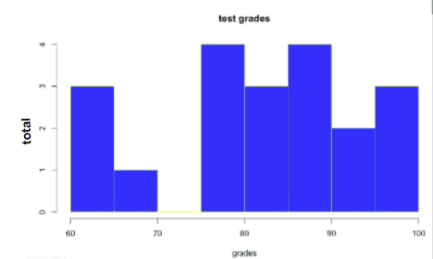
Here’s an example of a histogram being created from the data set for the variable TestGrades. The title of the histogram is test grades, the x label is grades, the y label is total, the column color is set to blue with a yellow border. Finally, the bucket width (column width) has been set to 10
hist(TestGrades,main="test grades",xlab="grades", ylab="total", col="blue", border="yellow", breaks=10)